
What does P-four-nines (p99.99) mean?
Was in a conversation about some service refactoring and the guy said “mean latency was a bit worse, but our P-four-nines was rock-solid and only twice the mean. Customer loved it.” #CloudThinking
— Tim Bray (@timbray) May 24, 2019
If you’re wondering what “P-four-nines” means, it’s the latency at the 99.99th percentile, meaning only one in 10,000 requests has a worse latency. Why do we measure latency in percentiles?
In 2001, I was managing the Performance Engineering team. We were responsible for the performance of the website, and we were frustrated. We were a few engineers fighting against the performance entropy of hundreds of developers adding features to the web site.
Latency kept going up, but we had a big problem: how to convince people to care. The feature teams had web labs that could show “if we add feature X to the page, we get Y more revenue.”
If that feature added 100ms to page latency and our only counter was “but latency is bad,” our argument didn’t carry the day. So we had to figure out how to make our argument stronger.
On March 21 and 22, 2001, our Oracle databases gave us a gift! At the time, the Amazon website was backed by seven “web” databases that were responsible for keeping track of the web activity, such as the contents of the customer’s shopping cart.
On those dates, one of the databases, “web7” was having some weird locking problems. Every so often, when the website tried to query for the customer’s data, it would pause for a few seconds. While this made life miserable for our customers, it was an opportunity for us!
Visitors to the website were randomly sharded across these databases, making this a great natural experiment. So I did some log diving!
I broke down our page serve times a bunch of different ways, but for this thread, I’ll just look at one, which is detail page latency.
On the Amazon web site, the “detail” page is the product page. The page that contains a single product with an add-to-cart button. We serve a lot of those pages and customers visit them for roughly the same reasons, so they were a good data set for me.
Here’s a graph I made. The green is a histogram of number of pages served at a given latency. So, for example, we served about 2000 pages in that hour at 250ms latency, and about 8000 at 1s. Note that the x axis is log scale.
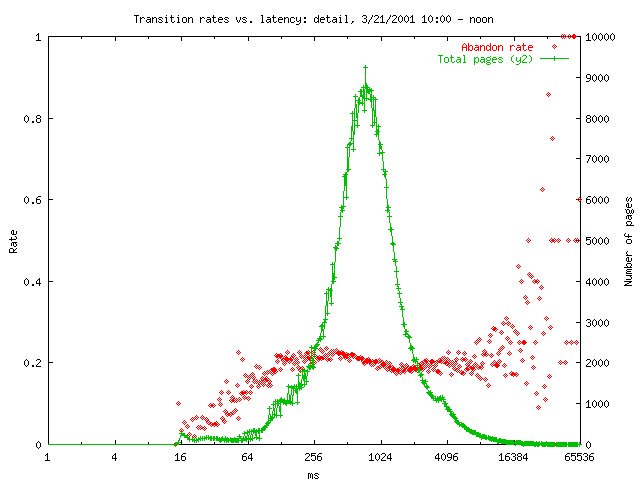
The red is the “abandonment rate.” It’s the ratio of pages for which that page was the last page the customer visited. So you can see that mostly every time we served a detail page, there was about a 20% chance that it would be the last page in a session.
The rate slopes down! Latency is good for keeping people on the website! Probably not, but it illustrates what I was up against. We knew that products with more reviews, more images, etc. sold better, and those things took more latency to serve.
Here’s the graph for that same time period for the customers being served by web7. That secondary hump in the histogram is the locking problems. The latency additions were effectively randomly distributed among the page loads (not correlated to customer).
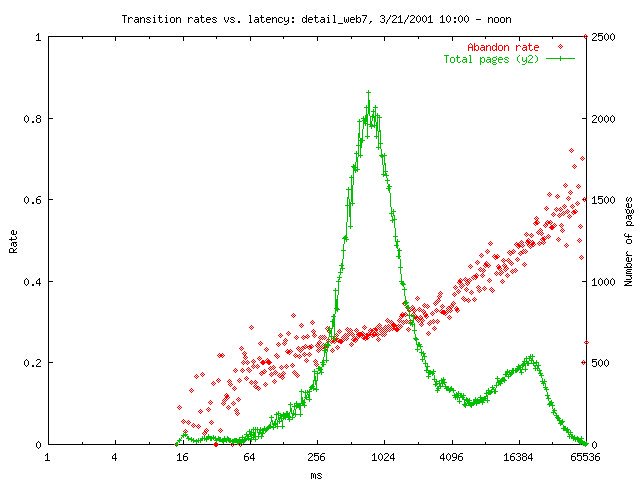
So each time a customer who happened to be mapped to web7 tried to load a page, there was a 20-25% chance that it would be served with an extra ~8-16s of latency. And obviously the abandon rate was much higher for pages served at that latency.
But the really scary thing to me was comparing the “normal” latency sections below. What we saw was that a customer was much more likely to abandon the site even for normal latencies after tolerating a slow page.
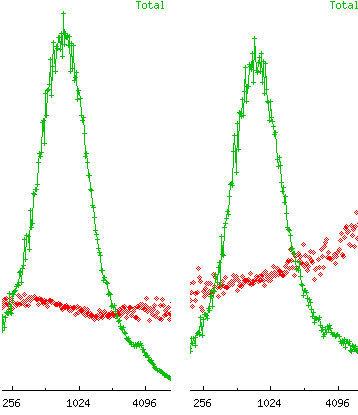
The abandon rate went from ~18% at 2s latency to ~32%. That’s a lot of pissed off customers! Extra latency for better content went from being an attractor to a detractor because of the customer’s prior page serve times!
From this, we decided that we (the performance engineering team) would not fight for better average latency, but for a maximum latency budget. We didn’t know exactly what the right answer was, but we knew it was somewhere between 4 and 8 seconds. So we picked 6.
And we knew that we couldn’t start off with an edict that no page could ever be served with more than 6s of latency. Instead, we thought about probabilities that a customer would have a bad session, which led us to set our SLAs at percentiles.
If a session was 10 pages on average and we set our SLA to say that no more than 1 in 10,000 pages would have a bad latency, then we would know that no more than 1/1000 customers would have a bad session. In shorthand, the p99.99 of latency needed to be <6s.
Armed with these graphs and this reasoning, I went to the VPs who owned the various web pages and argued that they needed to set these SLAs. In parallel, we (the perf engr) team built tools that made it really easy for developers to measure the latency of their pages.
That system, called PMET, let developers put little “start” and “stop” indicators in their code and then our system would scrape the logs and store the latency histograms in a database. If their page wasn’t hitting SLA, they could drill down and figure out why.
David Wagner wrote the prototype service for collecting and aggregating the data, and I wrote a simple visualization tool (using Perl and gnuplot).
The rest is history!
All things considered, it’s probably the most-impactful thing I have done in my 20 years at Amazon, and I did it in my first few years! That focus on high percentiles instead of averages has driven so much good behavior.
When James Hamilton started in AWS, we were chatting about PMET. When he heard that I had been one of the creators, he told me that when he read the Dynamo paper, the thing that had the biggest impact on his thinking from the paper was that we were focused on percentile latency.
PS. This outage and many others like it were the driving force behind developing Dynamo and getting off of relational databases. So lots of change happened because of the problems with these databases!
PPS. This thread is getting a lot of attention. Lots more than if it were just me yelling at you to “use percentiles.” Because humans love stories. And I agree it’s one of the good things about Twitter: that we can hear stories from people we don’t know.
But as useful as my story might be, it’s not nearly as important as stories that help us remember our shared humanity. No matter who you are, but especially if you’re a cis white guy in tech like me, I encourage you to follow people different from you and listen to their stories.
It can be challenging sometimes just to listen, especially when the stories express anger about people like you. But I encourage you to try, to hear what they are saying, and to remember that we’re all just trying to be OK in the world.
And if you are a cis white dude in tech, I know that you can also be fighting internal battles, getting dumped on by the world, and feeling pain. I’m interested in your stories too. Someday I may have the courage to share some of my deeper vulnerabilities here.
Until then, here are a few people whose stories I really value. Maybe give them a try. @EricaJoy @ewindisch @KatyMontgomerie @negrosubversive @kimmaytube @mykola @abbyfuller @ChloeCondon @ASpittel @jessfraz @QuetzalliAle @ErynnBrook @prisonculture @mekkaokereke @hirokonishimura